Financials of Ginza Industries Ltd.
Financial Report - GINZA INDUSTRIES LTD.
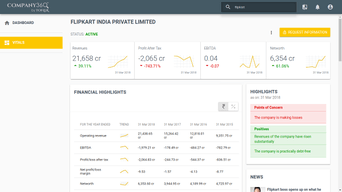
Here is a summary of financial information of GINZA INDUSTRIES LTD. for the financial year ending on 31 March, 2017.- Revenue / turnover of GINZA INDUSTRIES LTD. is INR 100 cr - 500 cr
- Net worth of the company has increased by 10.58 %
- EBITDA of the company has decreased by -1.55 %
- Total assets of the company has increased by 8.57 %
- Liabilities of the company has decreased by -9.73 %
Successfully added to cart.
For a detailed balance sheet
| Operating Revenue | INR 100 cr - 500 cr |
| EBITDA | -1.55 % |
| Networth | 10.58 % |
| Debt/Equity Ratio | 1.96 |
| Return on Equity | 9.92 % |
| Total Assets | 8.57 % |
| Fixed Assets | 4.90 % |
| Current Assets | 12.98 % |
| Current Liabilities | -9.73 % |
| Trade Receivables | 8.61 % |
| Trade Payables | 12.57 % |
| Current Ratio | 1.36 |
* Company has reported to have approved financials for 31 March, 2023. However, in case, they are not available at MCA because of non-filing or damage, then we will provide the latest financials downloadable from MCA.
How to get financials of GINZA INDUSTRIES LTD. in Company360
Tofler Company360 provides access to any Indian company's financial documents, charts, ratio analysis and more. It lets you compare financials of several companies and study performance trends. These financials can also be downloaded in excel format. Here is the video showing how you can study the financials of an Indian company on the Company360 platform.
Charges on assets - GINZA INDUSTRIES LTD.
| CHARGE ID | DATE OF CREATION/ MODIFICATION |
MODIFIED | AMOUNT | CHARGE HOLDER |
|---|---|---|---|---|
| 100888812 | 29 February, 2024 | NO | 9.00 cr | DEUTSCHE BANK AG |
| 100871455 | 29 January, 2024 | NO | 24.00 cr | State Bank of India |
| 100832060 | 16 December, 2023 | NO | 29.09 lac | HDFC BANK LIMITED |
| 100823590 | 20 November, 2023 | NO | 83.47 lac | HDFC BANK LIMITED |
| 100805959 | 06 October, 2023 | NO | 13.00 lac | HDFC BANK LIMITED |
| 10106989 | 03 August, 2023 | YES | 128.50 cr | UNION BANK OF INDIA (LEAD BANK) |
| 100754897 | 26 July, 2023 | NO | 24.88 lac | HDFC BANK LIMITED |
| 10471675 | 24 July, 2023 | YES | 52.41 cr | UNION BANK OF INDIA (LEAD BANK) |
| 100692634 | 23 March, 2023 | NO | 9.00 lac | Union Bank of India |
| 100692563 | 23 March, 2023 | NO | 8.60 lac | Union Bank of India |
| 100692623 | 23 March, 2023 | NO | 9.00 lac | Union Bank of India |
| 100696281 | 21 March, 2023 | NO | 9.00 lac | Union Bank of India |
| 100692570 | 21 March, 2023 | NO | 9.00 lac | Union Bank of India |
| 100654857 | 15 December, 2022 | NO | 36.35 lac | HDFC BANK LIMITED |
| 100691948 | 30 August, 2022 | NO | 12.00 cr | DEUTSCHE BANK AG |
| 100601780 | 06 August, 2022 | NO | 11.50 lac | UNION BANK OF INDIA |
| 100567340 | 27 April, 2022 | NO | 86.00 lac | IDBI Bank Limited |
| 100535071 | 02 February, 2022 | NO | 2.00 cr | State Bank of India |
| 100528969 | 28 January, 2022 | NO | 13.29 cr | UNION BANK OF INDIA |
| 100504287 | 23 November, 2021 | NO | 1.22 cr | Bank of India |
| 100507087 | 23 November, 2021 | NO | 1.78 cr | Central Bank of India |
| 100437397 | 29 April, 2021 | YES | 7.02 cr | UNION BANK OF INDIA |
| 100435494 | 10 April, 2021 | NO | 3.95 cr | State Bank of India |
| 100435130 | 26 March, 2021 | NO | 2.40 cr | Bank of India |
| 100432282 | 22 March, 2021 | NO | 17.66 lac | BANK OF BARODA IBB Kandivali |
| 100423738 | 05 March, 2021 | NO | 1.71 cr | IDBI Bank Limited |
| 100426737 | 10 February, 2021 | NO | 3.57 cr | Central Bank of India |
| 100277206 | 29 June, 2019 | NO | 2.24 cr | DEUTSCHE BANK AG |
5 Biggest Charges

Tofler, TWS Systems Private Limited and its officers respect the Intellectual Property Rights of all people. Tofler makes no claim of ownership or affiliation with any trademark (REGISTERED OR UNREGISTERED) that forms part of any Company/LLP name listed on this page. Trademarks, if any, listed on this page belong to their respective owners. Read More